How to Diagnose Core Web Vitals Failures at the Page Level
By Seth Black · Published · Updated
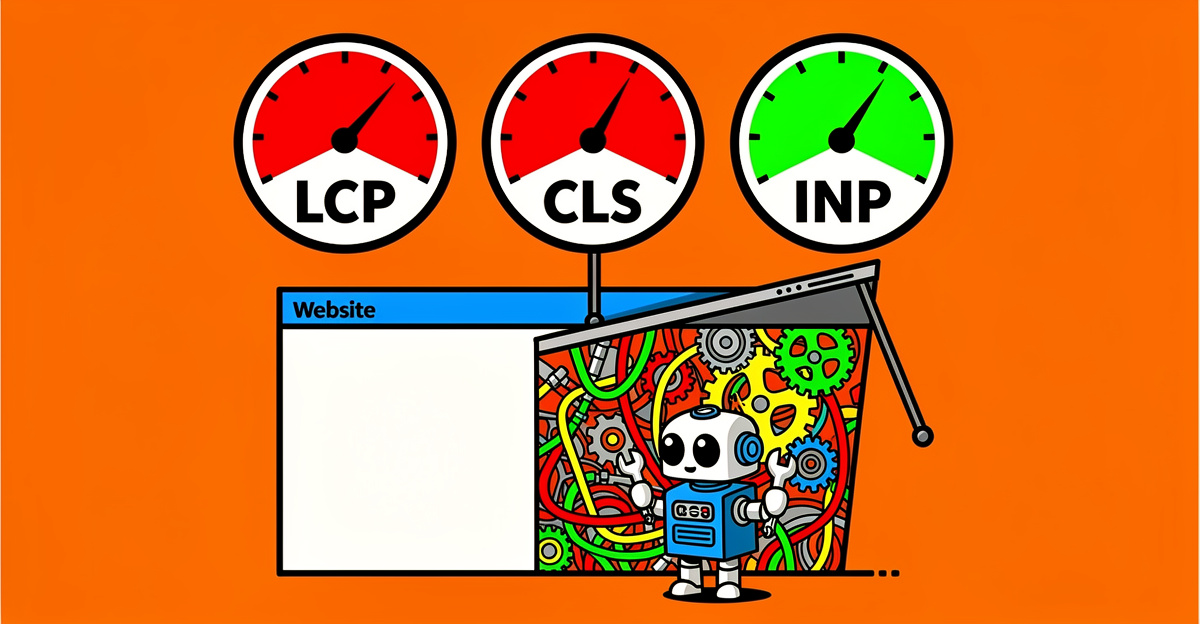
Google Search Console tells you that 1,247 URLs have “Poor LCP” and bundles them into a group. You click through and get a handful of example URLs. That’s it. No element attribution. No network timing. Just a bucket and a list of URLs that tells you nothing about what’s actually broken.
If you’ve ever tried to fix Core Web Vitals using only the Search Console report, you know the pattern. You guess at the template, you poke at a few pages, you hope the aggregate number moves in 28 days. Watching an aggregate number for 28 days is not a diagnostic process.
Here’s how I actually diagnose CWV failures at the page level.
Start with field data, not lab data
Lighthouse is useful for catching obvious problems, but Google ranks on field data from real Chrome users (CrUX), not a simulated Moto G4 on throttled 3G. Step one is pulling field data for the specific URL you’re trying to fix.
The PageSpeed Insights API will give you per-URL CrUX data if the page has enough traffic. If it doesn’t, you fall back to the origin-level data, which is less precise but still better than nothing. Pull LCP, CLS, and INP at the 75th percentile. That’s the number Google cares about.
BSA won’t give you field data, but it runs page-level Web Vitals checks during the crawl (render-blocking scripts, images without dimensions, a missing preload on the LCP element) and drops them next to the other audit findings for the same page, so once PageSpeed Insights tells you which URLs are failing, you already know where to look.
LCP: find the element, then find the blocker
Open the page in Chrome DevTools, go to the Performance panel, record a reload with network throttling set to “Slow 4G.” When the trace finishes, look for the LCP marker in the timings track. DevTools will tell you exactly which element triggered LCP.
The element is almost always one of these:
- A hero image that isn’t preloaded and is discovered late in the parser
- A webfont blocking text render until it downloads
- A data fetch that runs client-side before the hero content can paint — a pattern that also affects how Googlebot renders JavaScript vs. what your browser shows
- A render-blocking CSS file in the
<head>that’s bigger than it needs to be
Fix the actual element and the aggregate bucket in Search Console will follow, usually within a few crawl cycles.
CLS: the layout shift region is the clue
In DevTools, turn on “Layout Shift Regions” under the Rendering tab. Reload the page and watch for the blue highlights. Every flash is a shift. Common offenders:
- Images without explicit
widthandheightattributes - Ad slots or embeds that load and push content down
- Web fonts swapping in and reflowing text
- A cookie banner that injects after first paint
INP: the interaction is the thing
INP replaced FID and the change matters. FID only measured the first interaction, so a page that was sluggish on every click after that still looked fine in the report. INP catches the worst interaction across the whole session, which is closer to what users actually feel.
Open the Performance panel, start recording, then actually click, tap, and type on the page. Stop the recording and look for long tasks that line up with your interactions. The usual suspects are heavy JavaScript handlers, synchronous layout thrashing during a click, and third-party scripts hogging the main thread. SPA architectures in particular can introduce hydration failures and event listener blocking that tank INP without surfacing any obvious error.
Why CWV belongs inside the technical audit
Slow LCP is almost never just a CWV problem. It’s a render-blocking resource, or a 2MB hero image, or a missing preload hint — things a technical SEO audit run against the same URL already catches. That’s why BSA puts its Web Vitals checks next to the rest of the audit findings for the same URL.
When the CWV numbers sit next to the render-blocking resource list for the same URL, you stop guessing which problem caused which symptom. Standard audit tools often miss this connection entirely — which is exactly the kind of gap covered in what most SEO audit software overlooks.
BSA tags every issue with a severity, so you can filter out the noise instead of wading through 300 warnings. Try it free for 14 days, no credit card.
-Sethers